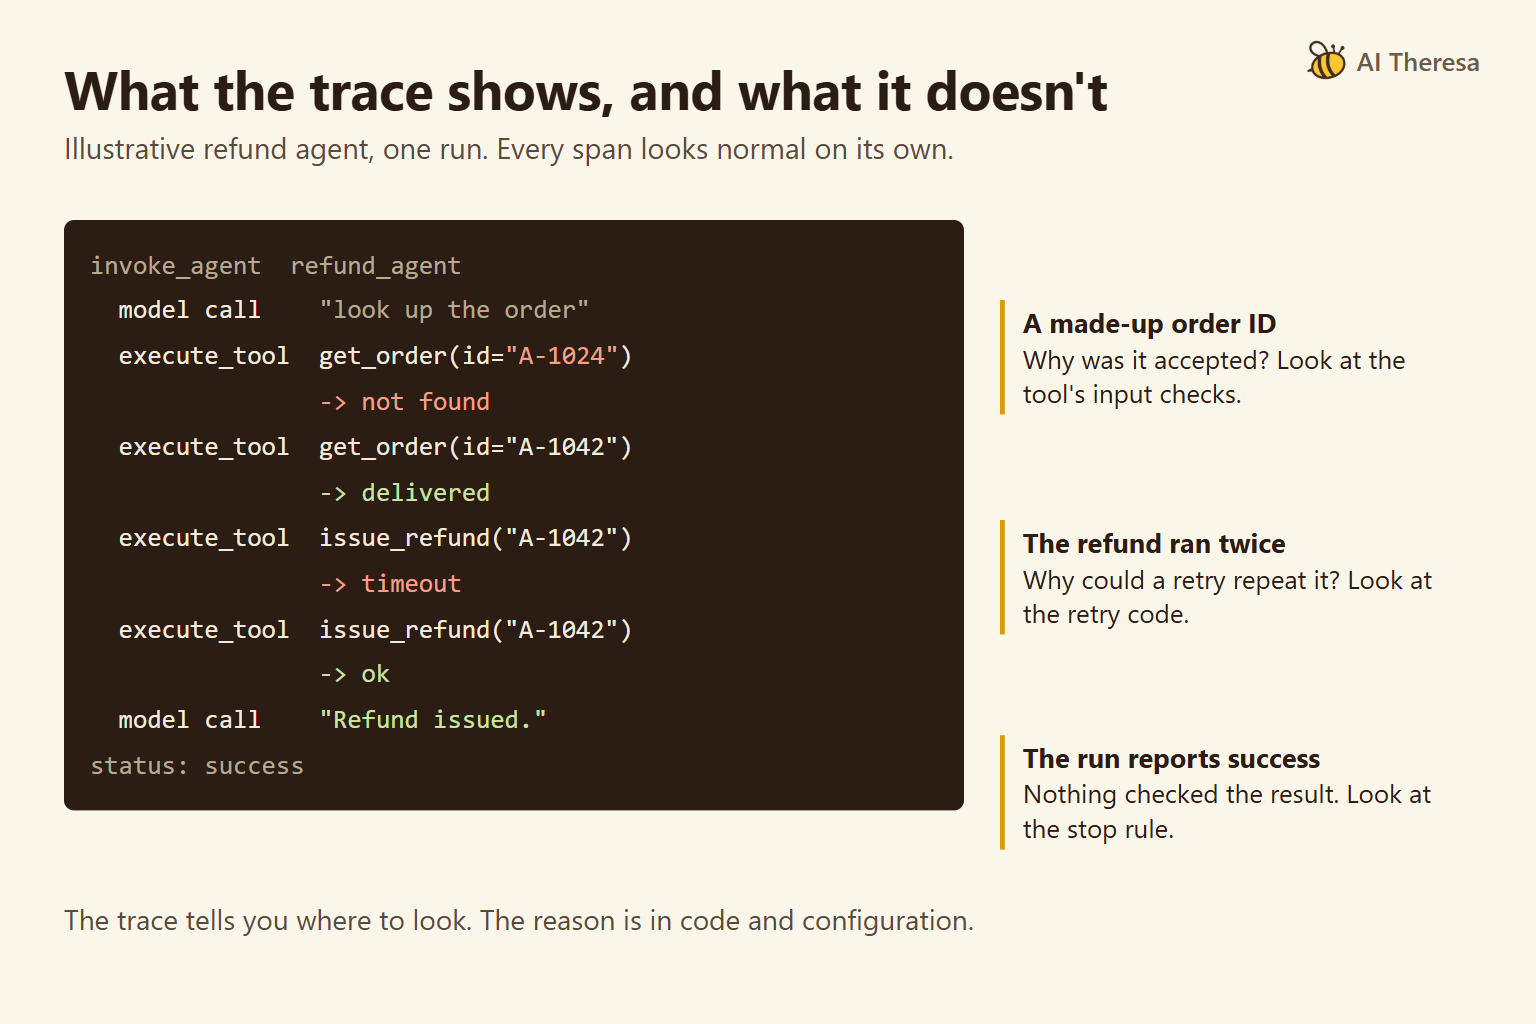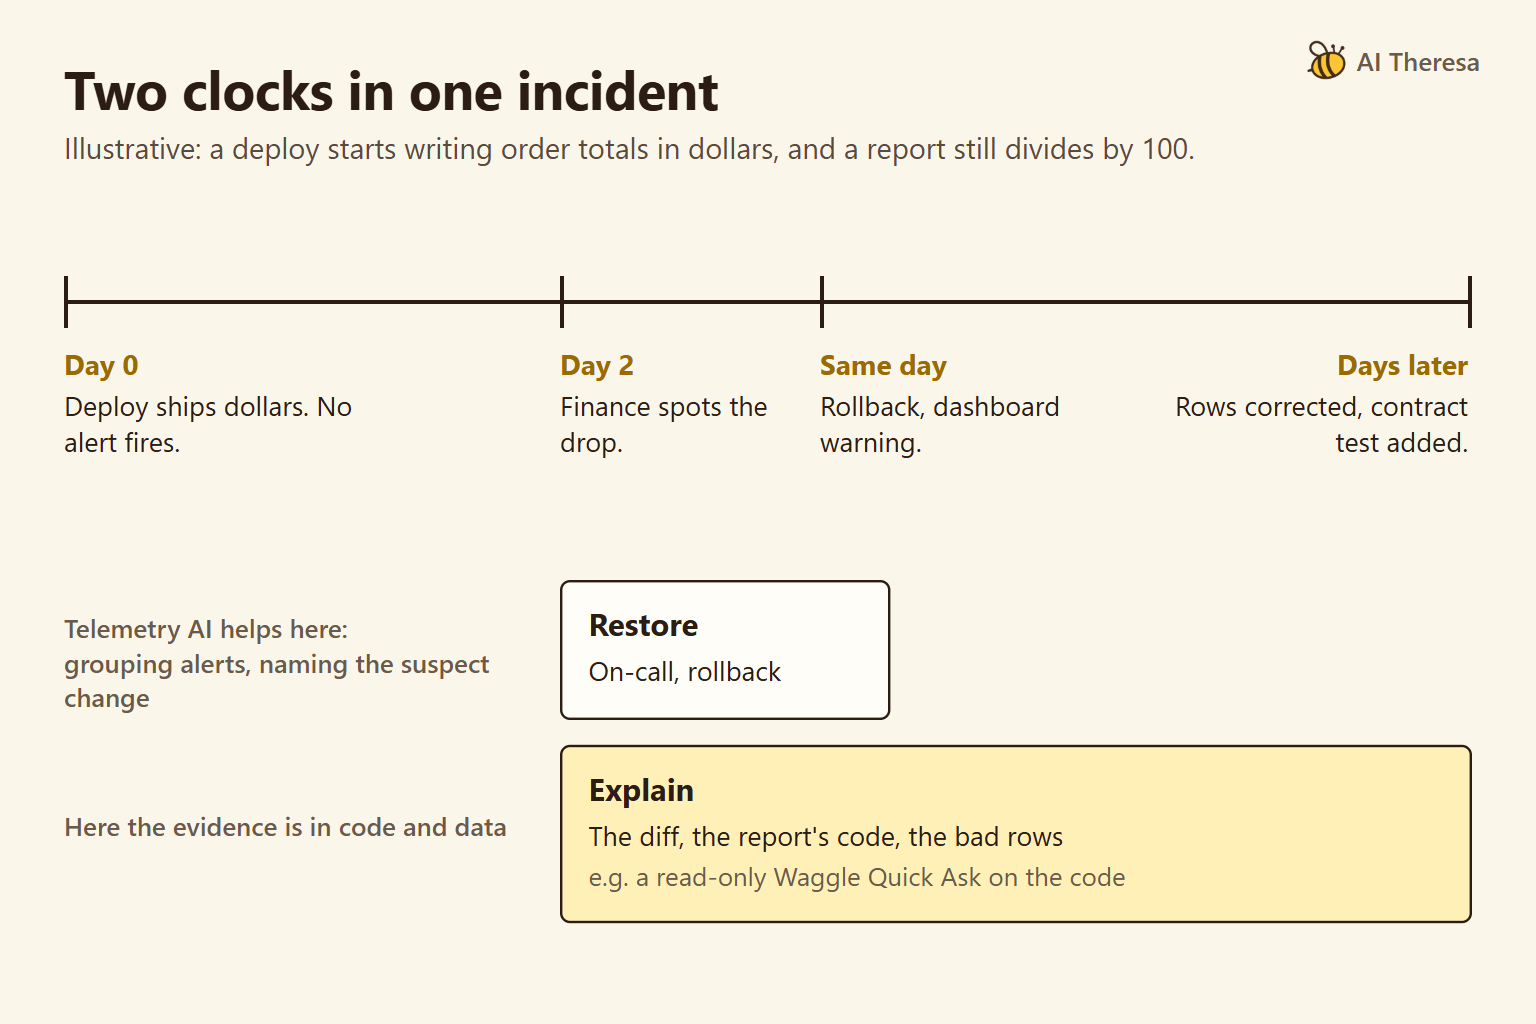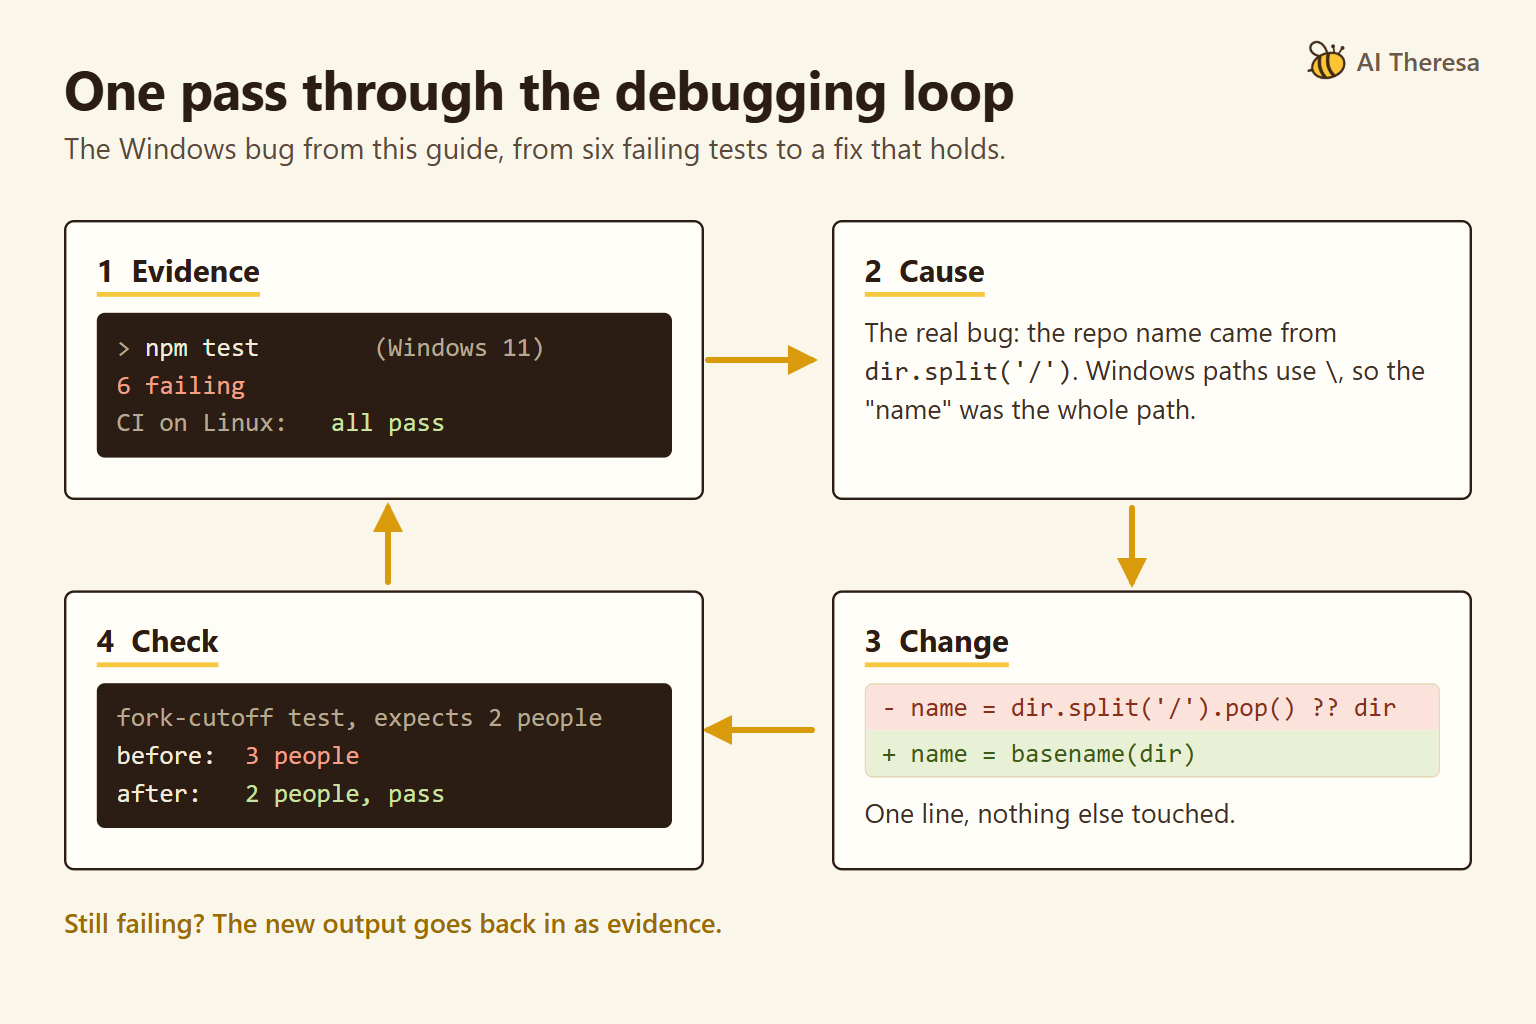
In August 2026, Elastic completed its acquisition of Deductive AI, whose technology is "designed to take on more of the investigation itself while keeping engineers in control." Error trackers, observability platforms and code editors now all sell AI that looks for root causes. With this many options, the useful question is what evidence each tool shows you.
AI-driven debugging uses AI models to find why software misbehaves, explain the cause, and propose or apply a fix. This list compares seven tools by one test: how well each establishes a root cause you can check.
We make the first tool on the list, Waggle, and we state the ranking criteria before the list begins. Positions two to seven run from production to the editor and are not ranked against each other.
What Is AI-Driven Debugging?
AI-driven debugging is the use of AI models to detect a bug, find its root cause, and propose, apply or check a fix. The root cause is the condition that produces the symptom, such as a wrong join behind a wrong total. The symptom is only what someone notices.
There are four kinds of tool. Editor assistants explain errors and suggest changes where you write code. Coding agents read a project, edit files and run commands. Production tools read telemetry (the errors, logs and traces a running system records) and propose a cause when something breaks.
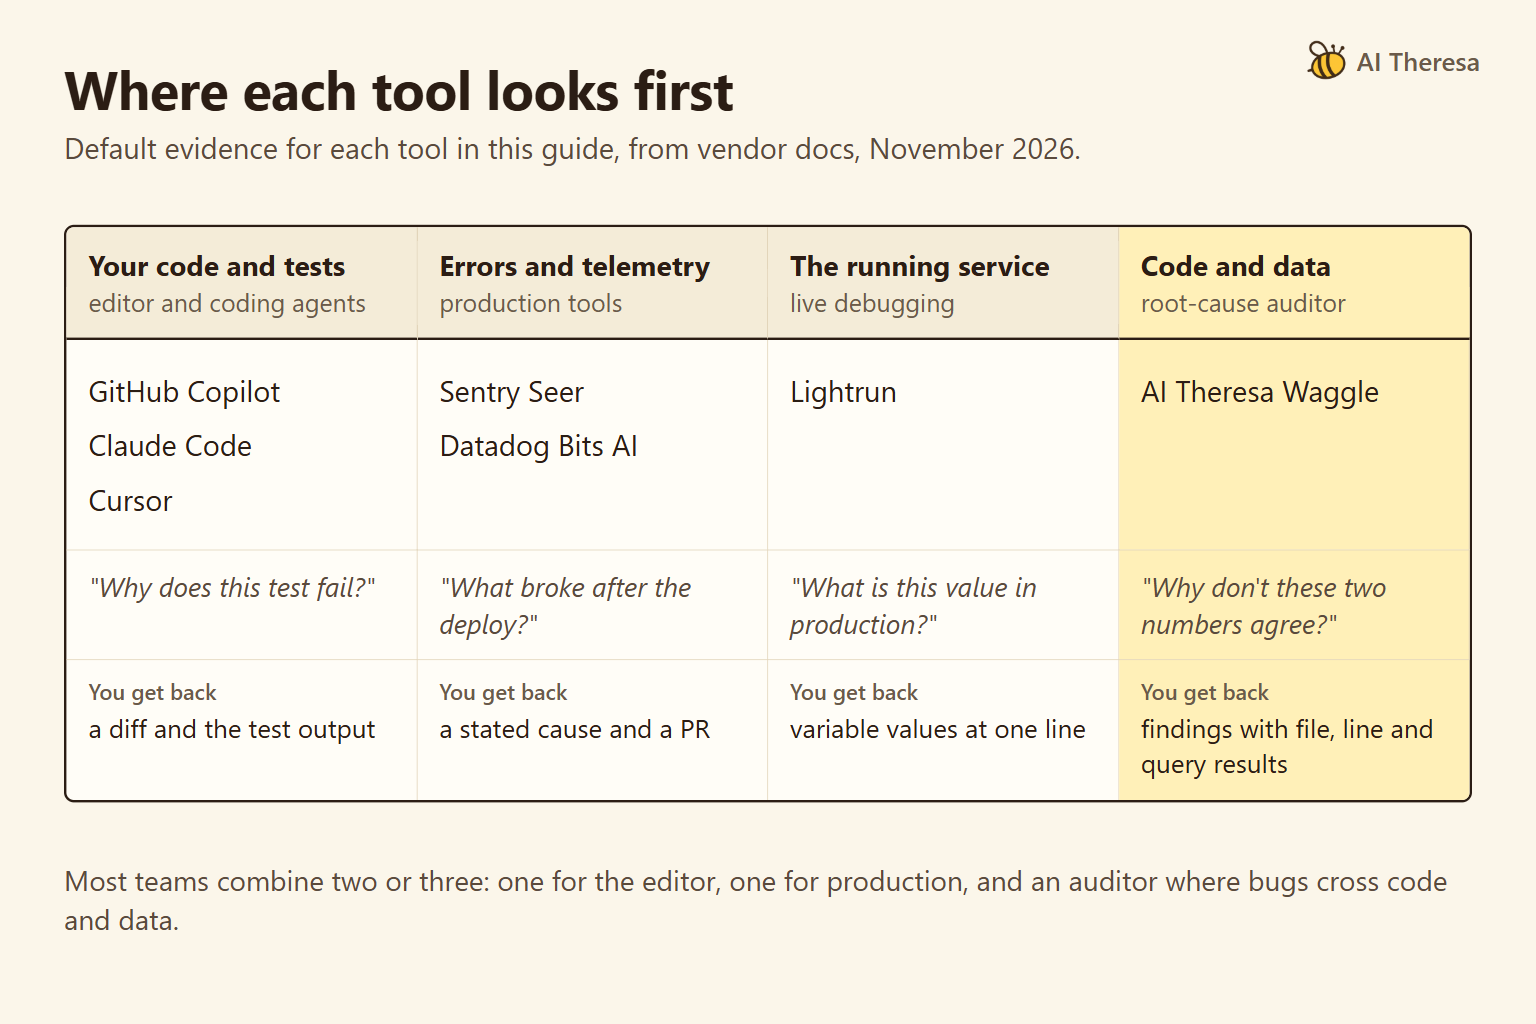
Root-cause auditors investigate code and data without changing either. The kinds differ most in the evidence they look at by default. A coding agent starts from your files and test output, and sees data only if you connect it. A production tool sees what the system recorded, and neither looks at warehouse rows unless someone connects them.
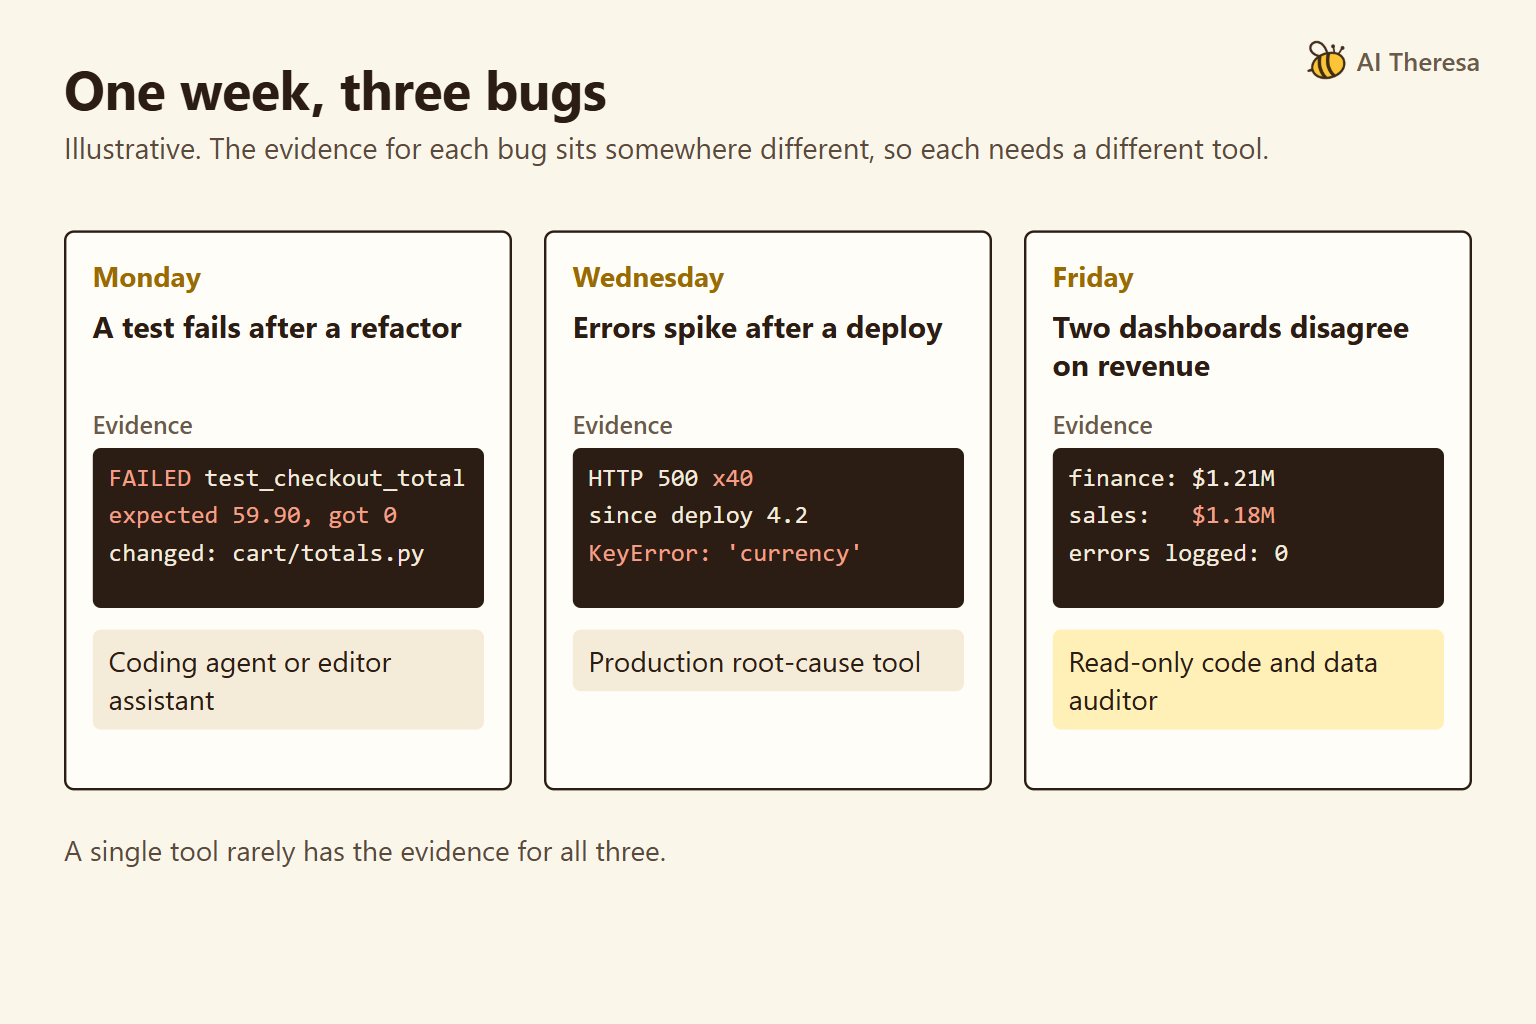
We use one illustrative scenario throughout. A team has three bugs in one week. A test fails after a refactor, exceptions spike after a deploy, and two dashboards disagree on revenue with no error anywhere. Our guides to AI code debugging and AI production debugging cover the first two in depth.
Get Started with Theresa for FREEKey Features to Look for in an AI Debugging Solution
Seven features matter most. Each one returns in the comparison table or the tool notes below.
Start with a stated root cause before any patch. A good tool names the cause it believes and the alternatives it ruled out. A patch that silences an error can leave its cause in place.
Next comes evidence you can check, such as a file and line, a query result, a trace or a runtime value. Plausible fixes are often wrong. A 2025 study re-examined patches from three agents that had passed SWE-bench Verified, a benchmark built from real GitHub issues. Using extra tests and manual review, the authors estimated that about 11% were still wrong.
Then look at the context a tool can reach: code only, telemetry, the running process, or the data itself. In our scenario, the revenue bug lives in the data. Any tool must be given read access to the warehouse before it can see it.
Control over changes matters too. Some tools only read, some suggest a change, some open a pull request (PR), and some edit files directly. Check whether a tool can edit tests, since a changed test can turn a run green without fixing anything.
Verification is a separate question. Ask whether the tool runs a check, proposes one, or leaves that to you. Copilot's agent mode reruns tests and Datadog's Bits Remediation checks that an issue is resolved. Waggle proposes a check for each finding but does not run it.
Check deployment and privacy as well: whether the tool is hosted or local, whose model keys it uses, and what it sends home.
Last, look for cost you can predict. Seats, active contributors, credits and per-run model use behave differently as a team grows.
Get Started with Theresa for FREEHow to Choose the Right AI Debugging Tool
Our list ranks by one criterion: whether a tool establishes a root cause you can check, across code and data. Every claim should resolve to evidence you can open, and the tool should report what it ruled out and what remains open.
Waggle was designed for exactly that, so the criterion favors our own product. Readers who weigh speed, IDE integration or on-call coverage would rank the list differently. On-call means the engineer paged when production breaks; for that, start with Datadog Bits AI or Sentry Seer. To fix a failing test in your editor right now, start with Cursor, Claude Code or Copilot.
The table maps each illustrative bug to its evidence and the tool that suits it.
| Your bug (illustrative) | Where the evidence is | Kind of tool that fits |
|---|---|---|
| A test fails after a refactor | Test output and the changed code | Coding agent or editor assistant |
| Exceptions spike after a deploy | Stack traces, logs and the deploy diff | Production root-cause tool |
| Two dashboards disagree on revenue, with no error | Metric code and warehouse rows | Any tool with data access; an auditor adds an evidence gate |
A coding agent connected to the warehouse could investigate the third bug too. An auditor differs in method: it tests stated hypotheses against code and data, read-only, and shows what it ruled out. Start with the kind of bug that costs your team the most time, whether that is failing tests, incidents or numbers that drift.
Best AI-Driven Debugging Solutions
We make Waggle, the first entry, so weigh the ranking with that in mind. We did not test the seven tools head to head. The comparison is based on vendor documentation and pricing pages as of November 2026, and prices link to those pages.
| Tool | Evidence it shows | Shows what it ruled out? | Changes your code? | Cost to start |
|---|---|---|---|---|
| AI Theresa (Waggle) | File and line, query results | Yes, plus open questions | Scans are read-only; optional fix step on a branch | Free software; needs an Anthropic key or Claude plan |
| Sentry Seer | Stack traces, traces, logs, code | States a cause | Opens a PR | Paid add-on |
| Datadog Bits AI | Telemetry queries | Yes: validated, invalidated, inconclusive | Opens a PR, never merges | AI Credits |
| Lightrun | Snapshots from running services | States a cause | No, suggests | Free AI SRE plan; Runtime Context custom |
| Cursor | Logs it inserted; PR comments | Tests several hypotheses with logs | Yes, locally | Free; Premium $30/mo for Bugbot |
| Claude Code | Commands it ran and their output | Only if you ask | Yes; approval is configurable | Pro $20/mo, or API use |
| GitHub Copilot | Explanations, test output | No | Yes, in the editor or as a PR | Free tier |
AI Theresa (Waggle)
Waggle is an open-source auditor of code and, optionally, the data behind it. It can query BigQuery, SQL, Redis or any MCP server, a standard tool connection for AI models. Scans never modify your code or data. For connected data, use read-only credentials, since Waggle can call whatever tools a server exposes.
It treats an audit as hypothesis testing. It proposes problems that could be proven false and measures each one against the code and data. A separate audit stage then re-checks every claim, which is a filter, not a test, since a model is checking a model. An unsupported claim becomes an open question, and a negative check is reported as ruled out.
Each finding comes with its evidence, a fix, and a step that tells you how to verify it. A leadership brief sums up the scan, and a REMEDIATION.md file gives a coding agent such as Claude Code a plan to work through.
The open-source edition is Apache-2.0 and runs on your machine with your own Anthropic key or Claude login. It sends anonymous usage telemetry by default, which you can turn off. A Quick Ask answers one question with cited evidence for about $0.30–1 in model use. A Full Scan costs about $5–30 and is capped, though a run can end up to about a third over the cap.
The Claude Code plugin runs the same audits from your terminal, and its fix command edits code on a separate branch with your approval. Enterprise adds an interactive report and editable org memory, runs in your cloud, and has custom pricing with a 14-day trial.
Waggle fits the revenue bug in our scenario. With the warehouse connected read-only, a Full Scan would compare the two metric definitions in code and test candidate causes with queries against the rows. Separately, Theresa's engineering team takes problems from diagnosis to a shipped fix; its case studies are service engagements, not Waggle scans.
It is not for stepping through a crash. It does not run code, has no debugger or tracing, does no on-call alerting, and is not inline in your IDE. A Full Scan takes 20–60 minutes. Waggle has published no accuracy benchmark, and its README warns that the audit reduces wrong claims but does not remove them.
Sentry Seer
Seer is Sentry's AI agent for errors that Sentry has already captured. It runs a root cause analysis on an issue using its stack trace, traces, logs and linked code. It can then write a fix and open a PR, or hand the work to Claude Code, Cursor Cloud Agents or GitHub Copilot.
Seer fits the exception spike in our scenario if the team already sends errors to Sentry. It is not for bugs that never raise a captured error. It supports only the cloud versions of GitHub and GitLab.
As of November 2026, Seer costs $40 per active contributor a month on top of a paid Sentry plan. An active contributor is anyone who opens two or more PRs in a Seer-enabled repository. On 8 December 2026, Seer moves to usage-based credits funded through a Seer Wallet, at prices Sentry had not published when we checked.
Datadog Bits AI (Bits Investigation and Bits Code)
Datadog's Bits AI has two parts for debugging. When an alert fires, Bits Investigation starts an investigation on its own and tests several root-cause hypotheses against Datadog telemetry. Each hypothesis is classified as "validated, invalidated, or inconclusive". Bits Code then writes a change and opens a PR, but never merges it.
Those labels are the closest thing on the telemetry side to Waggle's evidence gate, because they record what was ruled out as well as what was confirmed.
Bits AI fits the exception spike when an on-call team already runs on Datadog. It is not for teams without Datadog telemetry. Its docs also say Bits Code does not support investigations that span several repositories.
As of November 2026, AI Credits start at $500 for 500 credits a month, billed annually, or $1.30 per credit on demand. Datadog estimates about 4 credits per investigation and 5 per code fix. Credits come on top of the Datadog products that collect the telemetry.
Lightrun
Lightrun lets engineers and AI agents investigate live systems without a redeploy. Its Runtime Context product adds dynamic logs and snapshots to running services. A snapshot captures variable values at one line while the service keeps serving traffic. Lightrun AI SRE is an agent for site reliability engineering that handles triage, root cause analysis and remediation suggestions.
Lightrun fits a production bug you cannot reproduce on a laptop, such as an exception spike that appears only under real traffic. It is not for causes that sit in data or in code paths that never run. Runtime Context also needs an agent in each service, which some security teams will not allow.
As of November 2026, a limited AI SRE plan is free. Pro and Enterprise plans for both products have custom pricing.
Cursor (Debug Mode and Bugbot)
Cursor is an AI code editor. Its Debug Mode generates several hypotheses, adds log statements to test them, and asks you to reproduce the bug. It then reads the logs, makes a focused fix, and removes the logging once you confirm the fix. Bugbot reviews PRs for bugs and security issues before merge.
Debug Mode fits the failing test in our scenario, and harder cases such as timing bugs that reading alone cannot settle. It is not for bugs you cannot trigger, since it depends on runtime logs from your reproduction. Bugbot skips PRs larger than its review-size limit and asks you to split them.
As of November 2026, Cursor's plans start free. Bugbot needs Premium at $30 a month or above.
Claude Code
Claude Code is Anthropic's coding agent for the terminal, IDEs, a desktop app and the web. It reads a codebase, edits files and runs commands. Depending on your settings, it asks before each action or works more autonomously. It debugs best when you give it a failing test or another check it can run.
It fits the failing test after a refactor, especially when the change spans many files. It is not for unattended work without a check. Anthropic's guidance warns that an agent with no check stops when the work looks done, and "that makes you the test suite."
As of November 2026, Claude Code comes with the Pro plan and higher plans. Pro costs $20 a month. It can also run on API keys.
GitHub Copilot
GitHub Copilot works in the major IDEs, the command line and on github.com. In VS Code, a fix-test-failure command finds and fixes a failing test, and agent mode can run tests and retry. Copilot Autofix suggests fixes in PRs for CodeQL alerts, the findings from GitHub's code-scanning engine.
Copilot fits the failing test for a team that already works on GitHub, at the lowest cost of entry on this list. It is not for deep root cause analysis of production or data issues. Its own Autofix documentation warns that a fix may "fail to remediate the underlying vulnerability".
As of November 2026, Copilot has a free tier. Paid plans cost $10 to $100 a month for individuals and $19 or $39 per user a month for businesses. Each includes monthly GitHub AI Credits, and extra chat and agent use is billed per credit. Autofix does not need a Copilot subscription.
CodeRabbit, Qodo and Snyk Agent Fix are left off because they review PRs or patch security findings rather than find a root cause.
Get Started with Theresa for FREEConclusion
AI-driven debugging works best when you choose tools by the stage of a bug's life they cover and the evidence they show. A fluent answer is not evidence, so check what each tool shows you.
Most teams need one production tool and one coding tool. Add a root-cause auditor where bugs cross code and data. Leave the final call on any fix to a person and a check that tests the right behavior.