In April 2026, a coding agent in Cursor deleted the production database of PocketOS, a company that builds software for car-rental firms. Its recent backups went with it, and the company fell back to a three-month-old copy. Asked why, the agent wrote: "I violated every principle I was given: I guessed instead of verifying," but that reply is model output, not a diagnosis. The founder's account pointed to the system instead: the agent could reach an API token allowed to delete volumes, and the recent backups lived on the volume they were meant to protect.
AI agent debugging is the work of finding out why an agent's run went wrong and changing the system so the failure stays fixed. The evidence is spread across model calls, tool calls, saved state, and handoffs between agents. Tracing tools record what happened in a run. The cause often sits in code and configuration that no trace shows.
This matters once an agent takes several steps, calls tools, or passes work to other agents. Two things make it harder than ordinary debugging. The same input can produce a different run each time, and many failures raise no error at all. A single model call that gives a weak answer is usually a prompt or context problem and needs less of this method.
What Is AI Agent Debugging?
AI agent debugging means locating the step where an agent's run went wrong, explaining why, and fixing the prompt, tool, or code responsible. An agent, here, is software in which a language model chooses the next action until it decides the task is done.
A few terms recur. A run is one attempt at a task, and a trace is the record of that run. A trace is made of spans: timed entries for each model call, tool call, or handoff.
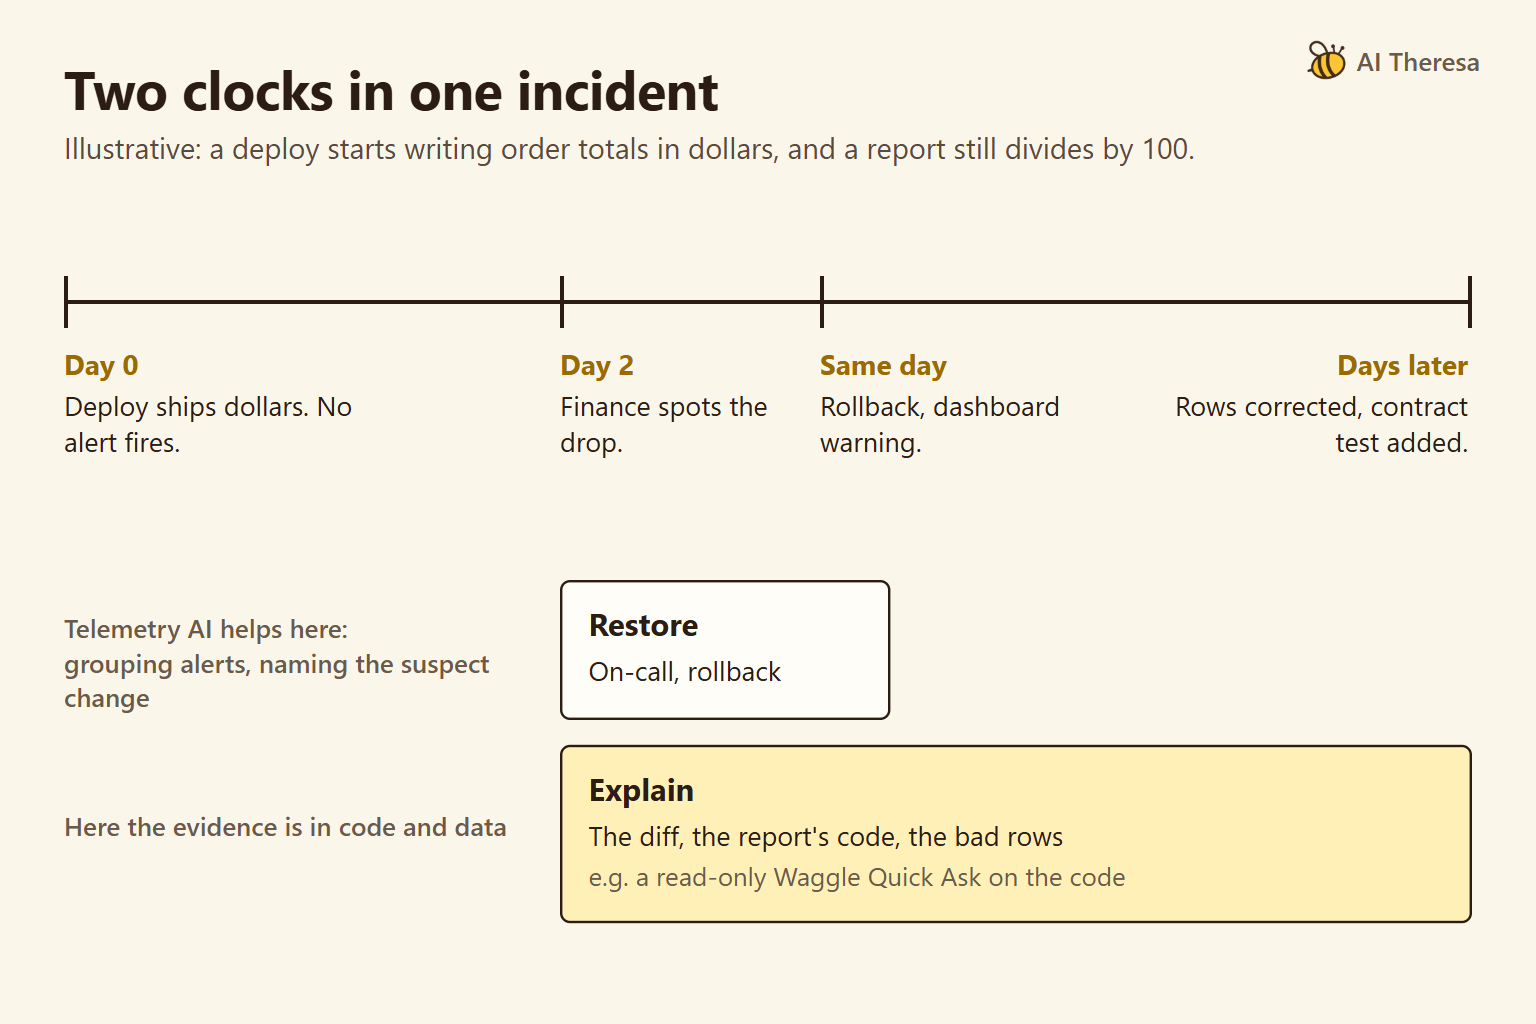
A tool call is the model's request to run a function, such as a search or a database query. A handoff passes control from one agent to another. Monitoring tells you that runs are failing; debugging finds out why one did.
OpenTelemetry, the open standard for traces, has draft conventions for AI agents that name these parts, with span types such as invoke_agent and execute_tool. They are still at "Development" status, not yet stable, so names can change.
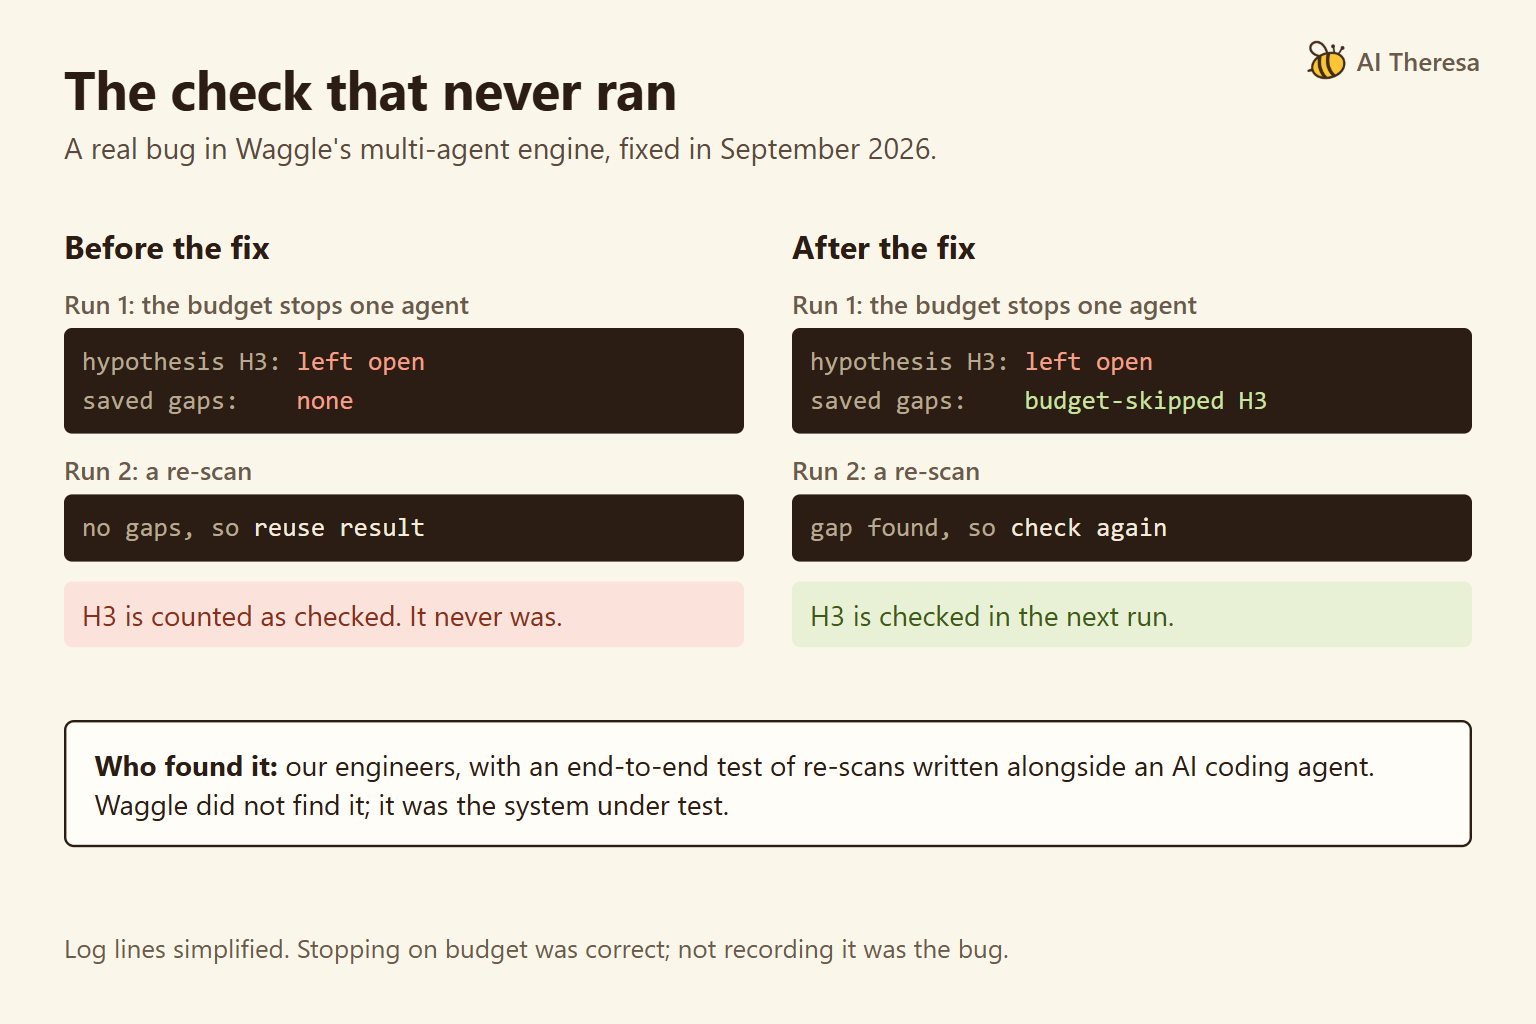
Our running example is a real bug in our own multi-agent pipeline, the engine behind Waggle, our open-source code auditor. Several expert agents work in parallel under a shared spending limit. When the limit stopped one agent early, the pipeline did not record the unfinished work. A later run then counted that work as done.
Get Started with Theresa for FREEAI Agent Debugging vs Traditional Debugging
Traditional debugging assumes that the same input gives the same result and that a failure announces itself. Agents break both assumptions. The model can choose a different tool on the next run. A wrong answer can arrive with a success status and a confident tone.
Our AI code debugging guide covers the traditional case, where a failing test is the starting point.
| Question | Traditional software | AI agent |
|---|---|---|
| Does the same input give the same run? | Usually | Often not, even with identical prompts |
| What does failure look like? | An exception or a failing test | A plausible wrong answer, a loop, or an early stop |
| How do you reproduce it? | Run it again | Replay a recorded run, or run it many times and count successes |
| Where does the bug live? | In the code | In a prompt, a tool's contract, coordination code, or the model's choice |
| What counts as fixed? | The failing test passes | The task succeeds across repeated runs |
The last row matters most, because one green run proves little when the next run may take a different path. The authors of τ-bench, a benchmark of customer-service agents, measure this with pass^k. It is the chance that all k attempts at the same task succeed, averaged over tasks. Unlike pass@k, which asks whether any one attempt succeeds, it rewards consistency.
In their 2024 tests, gpt-4o succeeded on most retail tasks in a single try. It succeeded on all eight tries for fewer than 25% of them. Newer models score higher, but a gap between one try and eight is what makes agent bugs slip past a single test run.
Anthropic's multi-agent research system write-up describes the same problem. Its agents are non-deterministic between runs, even with identical prompts, which made debugging harder. For agents that change records, the team evaluates the final state rather than the exact path taken.
Get Started with Theresa for FREEHow Do AI Agents Work Internally?
Most agents run a loop. The model reads its instructions and the context so far, then picks an action, usually a tool call. The application runs the tool and returns the result. The model reads it, updates its view of the task, and either acts again or stops.
Anthropic's guide to building agents says agents need "ground truth" from the environment at each step, such as tool results, to judge their progress. That makes every tool result a point where errors enter. An empty list, a vague error, or a stale record can steer every later step. Anthropic's research team found the reverse also holds: when an agent is told that a tool is failing, it can often adapt.
State is what the agent carries between steps: the conversation, its notes, and any records it saved. Long tasks can exceed the context window, the amount of text a model can read at once. Older steps are then summarized or dropped, and lost details return as repeated work or forgotten constraints.
The stop condition decides when the run ends. It can be the model declaring success, a step limit, a timeout, or a budget. A loop that never stops is easy to notice. A run that stops early and still looks complete is much harder.
Multi-agent systems add an orchestrator: the code that splits work among agents, collects their results, and decides what is finished. Handoffs can lose information, and the orchestrator can misread what an agent returned. In our example, the agent stopped correctly when the budget ran out. The orchestrator then stored its unfinished work as if it were complete.
Get Started with Theresa for FREEMost Common AI Agent Failure Modes
Researchers now classify agent failures from real traces. MAST, a study of multi-agent failures, annotated 1,642 traces from seven multi-agent frameworks. It found 14 failure modes in three categories: system design issues, misalignment between agents, and task verification. Its authors conclude that many failures come from how the system is organized, rather than from any single agent's limits.
Single-agent studies add detail at the level of tools. In τ-bench, a common agent error was calling the right tool with one or more wrong arguments. Models also called tools with IDs that did not exist, and weaker models did so far more often.
Anthropic reports similar patterns in its own system. Early versions of its research agents spawned 50 subagents for simple queries and searched endlessly for sources that did not exist. Since each agent is steered by a prompt, the team worked on these mainly by changing prompts.
The table combines these sources. Its last column shows where a fix usually goes.
| Failure mode | What you see in the trace | Where the fix usually lives |
|---|---|---|
| Wrong arguments or invented IDs | A valid tool call with a bad value | Tool schema, input checks, error messages |
| Step repetition | The same call several times in a row | Loop limits, state the agent can read |
| Unaware of termination conditions | The run continues after the task is done | Stop rule in the prompt or orchestrator |
| Reasoning-action mismatch | The plan says one thing, the tool call another | Prompt, tool description |
| Premature termination | The run ends before the goal is met | Stop rule, orchestrator |
| No or incomplete verification | The run ends with work unchecked | Verification step, orchestrator |
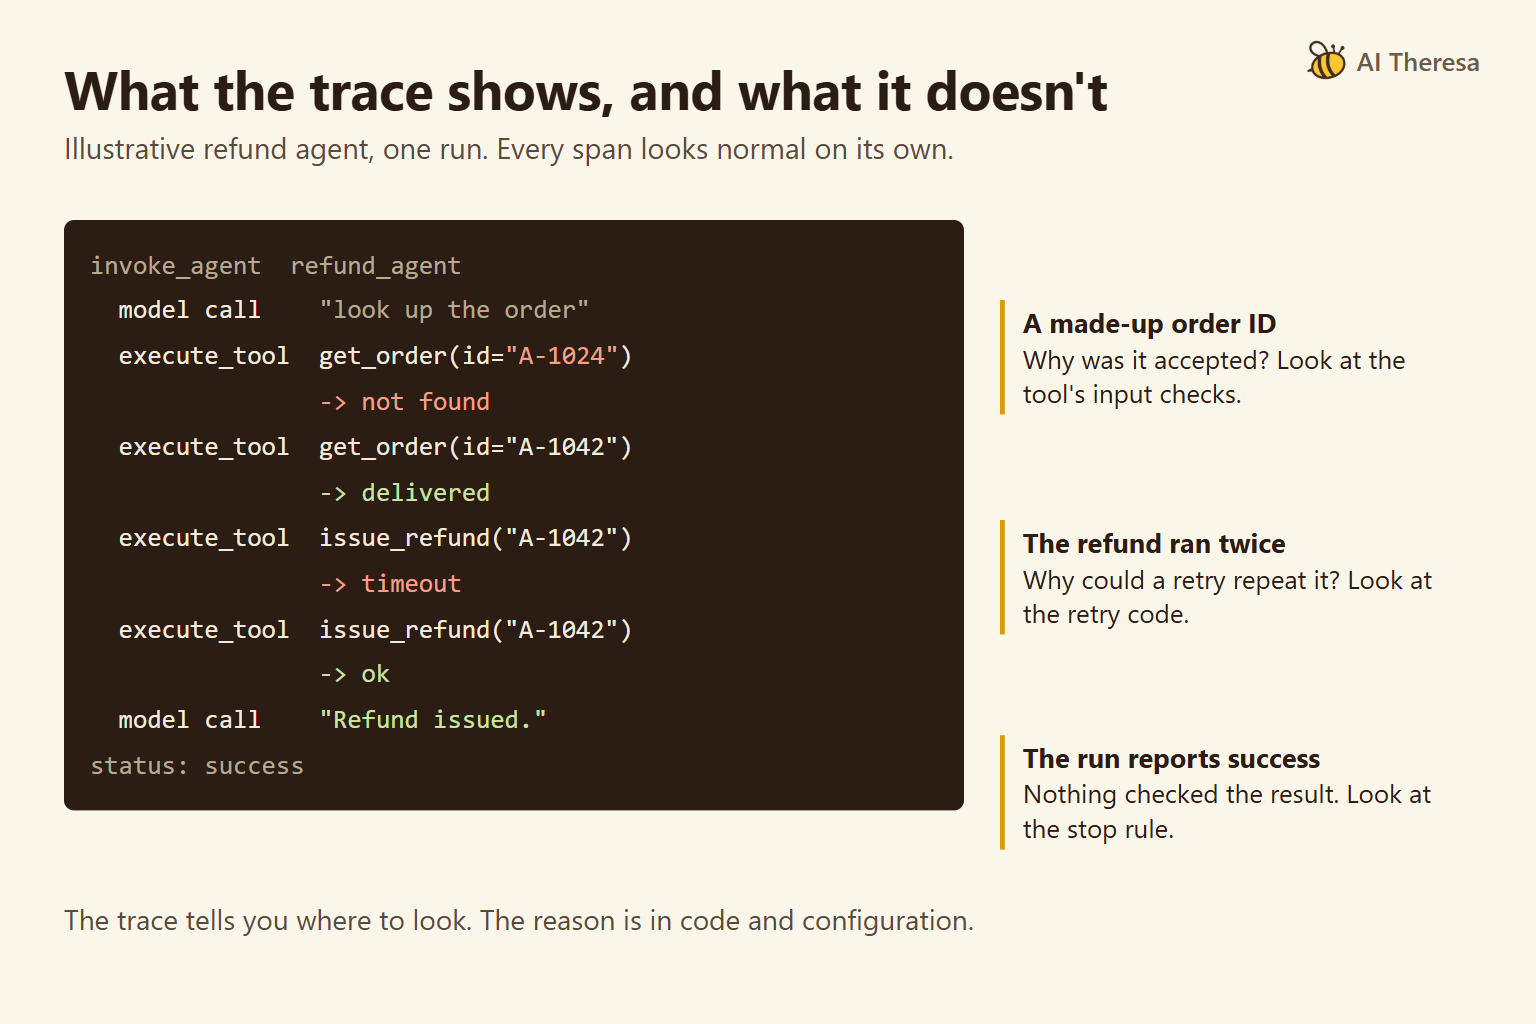
Most rows end in code or configuration. A trace tells you which row you are in, and the fix usually sits somewhere else. The refund run in Figure 1 shows two of these rows, an invented ID and a run that ends unchecked, plus a retry that repeated a side effect.
Our example fits only partly. The agent stopped on purpose when the budget ran out, which was correct, so it was not premature termination. It is closest to incomplete verification, because nothing checked that the agent's work was finished.
Its core, though, was a bug in saved state that carried the error into the next run. MAST studies single runs and has no row for that. A taxonomy helps you name a failure, but it will not have a row for every one.
Get Started with Theresa for FREEHow to Debug AI Agents Step by Step
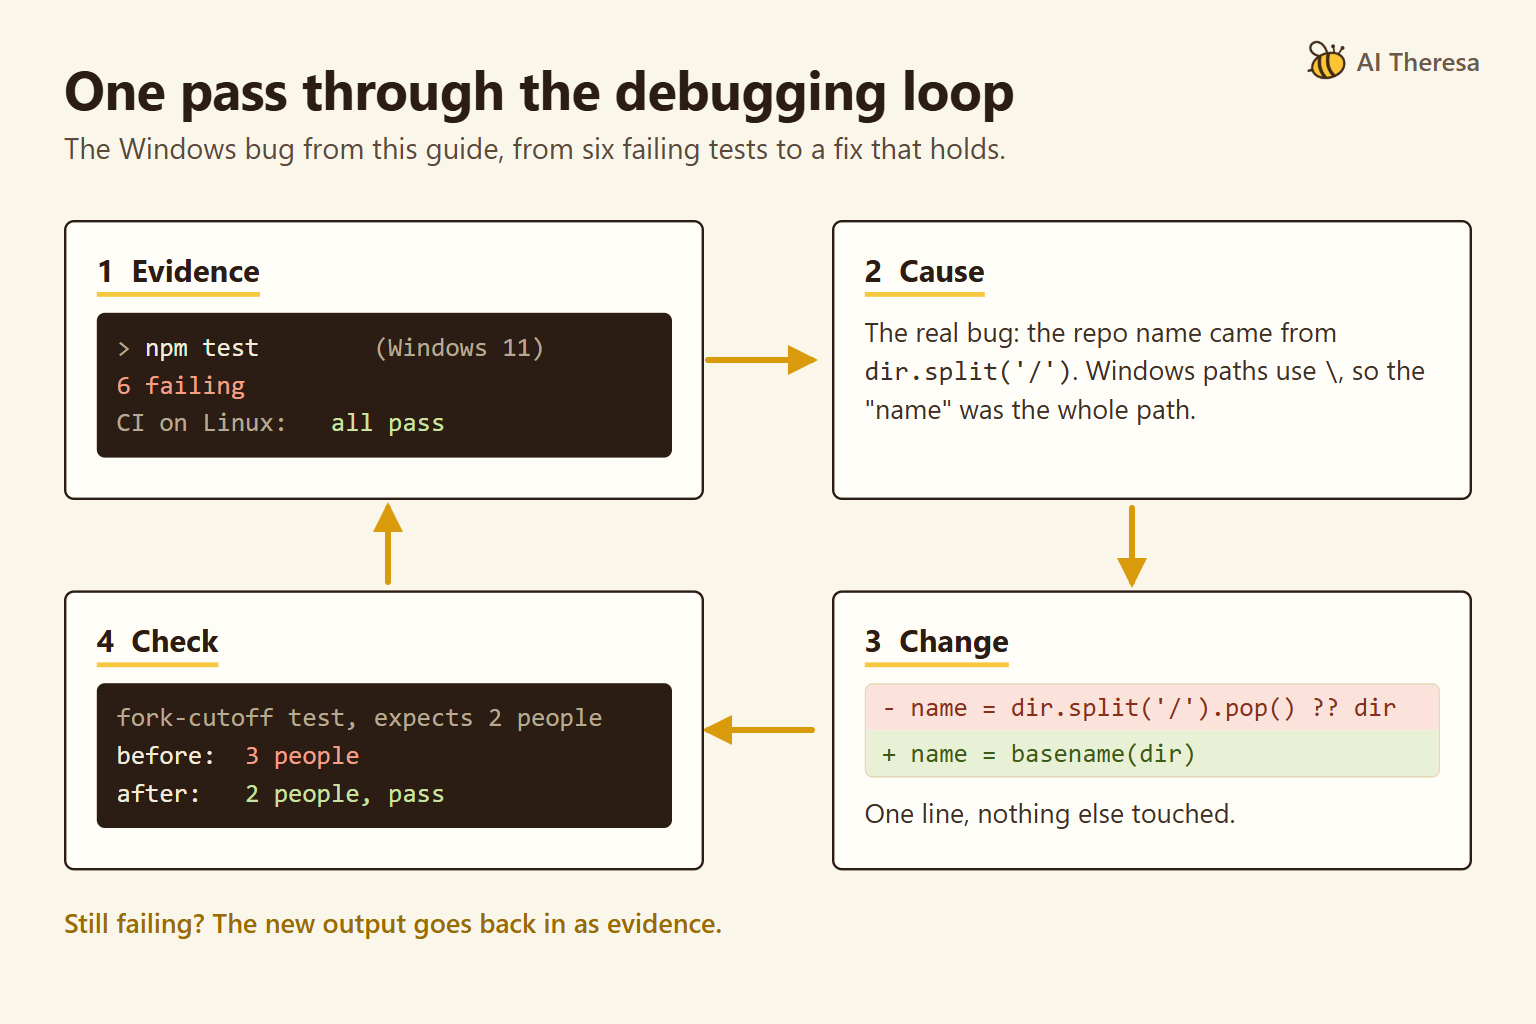
The steps follow the running example from the first clue to the merged fix.
1. Capture the full trace, including tool inputs and outputs
Without tool arguments and results, a trace shows that a call happened but not what went in or came back. OpenTelemetry makes both opt-in. The OpenAI Agents SDK captures them by default and warns that they may contain sensitive data. Decide what to redact before traces leave your systems.
Our engineers hit this bug while writing an end-to-end test of re-scans with an AI coding agent. Waggle did not find it; Waggle was the system under test. The run log served as the trace, and one line said a hypothesis, a claim the agent had to test, was left open when the budget ran out.
2. Make the failure repeatable
Rerun the failing task several times and count successes. Then save the model and tool responses from a failing run and replay them, so every rerun follows the same path. Change one step in the replay. If the run now succeeds, that step is a strong candidate for the cause.
Our bug sat in plain code but needed two conditions. A budget cut had to leave a hypothesis open, and a later re-scan had to reuse that agent's results. Spending varied by run, so we reproduced it with a small saved input instead.
3. Find the first step that went wrong, and name it
Before blaming the agent, check the task and the grader. In τ-bench's review of 40 failed gpt-4o retail runs, 4 came from typos or ambiguity in the user instructions.
Then work backward from the last error to the decisive step, the first one after which the run could not succeed. In our case, the second run only reused what it was given. The decisive step was in the first run, where the orchestrator stored the agent's work without the open hypothesis. Its failure mode, incomplete verification, pointed us to the orchestrator.
4. Read the code and configuration behind that step
The trace shows what a step did. The code shows why the system allowed it. Check the tool's schema, how it reports errors, whether a retry can repeat a side effect, and how the loop decides it is done. For PocketOS, the questions were which token the agent could reach and what that token was allowed to do.
In our case, the log held the clue, but the bug lived in orchestrator code, which our engineers read by hand. The pipeline judged a share of work complete if it had no recorded gaps. An open hypothesis was not recorded as a gap, so the work looked complete.
5. Fix the smallest thing, then confirm it
Change the one thing that allowed the failure. Our fix records every hypothesis the budget left open as an explicit "budget-skipped" gap. Work with such a gap is never reused or counted as re-checked. A unit test with a saved input asserts the gap and the lack of reuse, which suits plain code.
When a fix changes a prompt or a tool description, rerun the task instead. If the bug failed one run in five, 15 clean runs in a row would happen by chance only about 4 times in 100. Add the case to your evaluation set, run it on every change, and watch production. Our enterprise AI agent deployment guide covers operating live agents.
Best AI Agent Debugging Tools
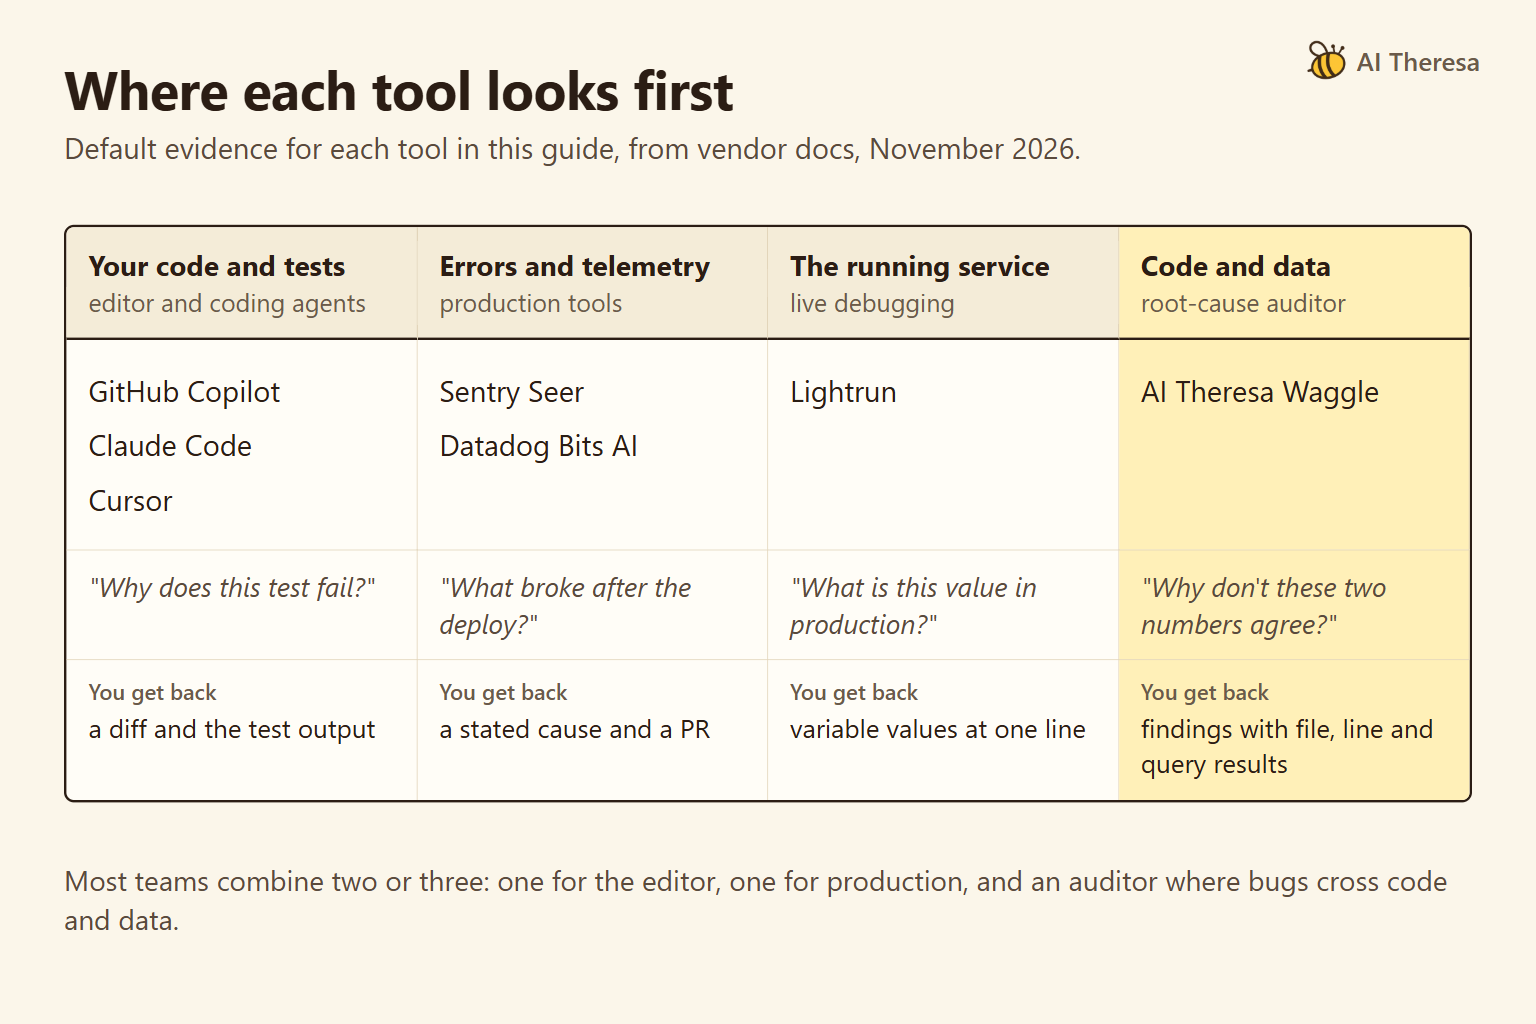
We compare the evidence each tool gives, whether its source is open and it can be self-hosted, and its cost as of November 2026. Several accept OpenTelemetry data, which limits lock-in.
LangSmith
LangSmith, from LangChain, records traces and evaluations and suits teams on LangChain or LangGraph. The platform is closed source, and self-hosting is an Enterprise add-on. One developer seat is free, and Plus costs $39 per seat per month.
Langfuse
Langfuse records traces, sessions, and evaluations. Its core is MIT-licensed, with some enterprise directories under a separate license. You can self-host it, and its cloud version has a free tier.
Arize Phoenix
Phoenix traces model calls, retrieval, and tool use, and runs on your own server at no cost. Arize calls it open source, but its license is the Elastic License 2.0, which is not OSI-approved. Read the terms before offering it to customers as a hosted service.
Braintrust
Braintrust centers on evaluation, and its datasets can be built from production logs, so a failing run can become a test case. The platform is closed, and self-hosting is for Enterprise customers. Starter is free, and Pro costs $249 per month.
W&B Weave
Weave records the inputs, outputs, and timing of each function you mark, with evaluations. Its SDK is open source under Apache-2.0, and private hosting of the platform is an Enterprise option. A free tier exists, and paid plans start at $60 per month.
OpenAI Agents SDK tracing
The MIT-licensed SDK records model calls, tool calls, handoffs, and guardrail checks by default and shows them in OpenAI's Traces dashboard. Processors can export traces to other tools. Tracing is unavailable to organizations under OpenAI's Zero Data Retention policy.
AI Theresa
A trace shows the bad tool call but not why the code allowed it. Waggle, the open-source auditor we build at AI Theresa, works on that second question. It reads a repository, and optionally its data, without changing anything or running the code.
Waggle has no checks built specifically for agents, so what it examines depends on the question you ask. A failing span can become a Quick Ask. For the refund run in Figure 1, ask: "Can a retry of issue_refund send the same refund twice?" Through the Claude Code plugin, the answer comes with file and line evidence.
It is Apache-2.0 licensed and runs locally on your Anthropic key or Claude login. A Quick Ask typically costs $0.30 to $1 in model use, and a Full Scan of whole repositories $5 to $30. Findings come with a fix and a way to verify them.
Waggle has no runtime view, and it has not published an accuracy benchmark. Its findings come from language models, so verify each one before you act.
Get Started with Theresa for FREEChallenges in AI Agent Debugging
Attribution is hard even for researchers. Who&When collected failure logs from 127 multi-agent systems and labeled the responsible agent and the decisive error step. In the paper's current version (June 2025), the best of three automated methods found the right agent 53.5% of the time. It found the right step only 14.2% of the time.
Later work such as AgenTracer trained a small model for the task and reports that it beats large general-purpose models on the same benchmark. Step-level attribution remains an open research problem, so a person still reads the trace and confirms any suggested cause.
When the MAST authors improved one framework by clarifying agent roles and, separately, by adding a high-level verification step, success rates rose. They still report that "task completion rates still remain low."
Reliability is expensive to measure. Pass^k means paying for k runs of every scenario, and a large evaluation set multiplies that cost. A common compromise is to rerun the cases that failed or changed and to sample the rest. Standards are also young, so attribute names in your traces may change.
Long-running agents complicate both fixes and releases. A restart from the beginning is expensive, so Anthropic built its research system to resume from the point where an error occurred. It also shifts traffic gradually to new versions, because a code change can break agents that are already mid-task. A bug can therefore depend on which version started a run and which one finished it.
Silent failures are the hardest. A crash gets attention, while a run that quietly does less than it reports does not. In our example, no stage raised an error and the report looked complete. Only a line in the run log showed the difference.
Waggle's public README states a related principle: "Fail open, visibly". A failed agent or connector is recorded as a degraded stage on the run, so coverage does not shrink in silence. The budget fix applies the same rule to unfinished hypotheses.
Get Started with Theresa for FREEConclusion
AI agent debugging needs two kinds of evidence. Traces and repeated runs show what an agent did and how often it fails. Prompts, tool contracts, and orchestration code show why the system allowed it.
Capture complete traces, make the failure repeatable, and find the first step that went wrong. Then fix the failure where it lives, often in code or configuration. Accept the fix only when a check shows it holds: repeated runs for model behavior, a deterministic test for plain code.